Tabular Data
Tabular Data and its Uses:
Introduction: The term “tabular” refers to data that is displayed in columns or tables, which can be created by most BI tools. These tools find relationships between data entries in one or more databases, then use those relationships to display the information in a table.
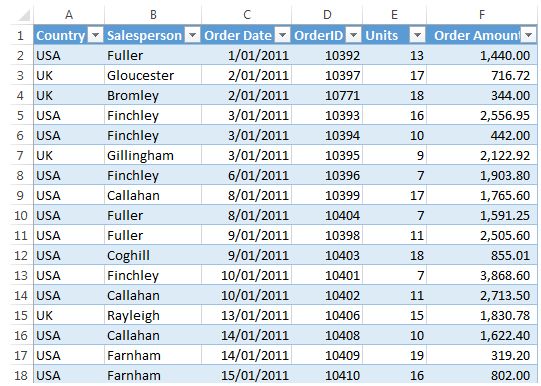
Tabular data is typically at a granular level of detail. Often transactional i.e. every row represents one transaction.
As is the case with the example above, where every row represents one order and has the related data for that order in a single row i.e. country, salesperson, units and amount.
When you start at this bottom level of detail it’s easy to summarise or slice and dice your data into any number of combinations with PivotTables, SUMIFS, COUNTIFS, etc.
But when you skip this step and start with data that has already been summarised it is much more difficult to change the summary format, and it often means you can’t use a lot of the built-in Excel tools and functions in the way they were intended.
The rules for tabular data:
-
Every record is housed on one row.
-
Each Column contains a type of data e.g. date, order number, quantity, amount, salesperson, region etc.
-
There are no blank rows or columns. Note: blank rows aren’t the end of the world but they will make your life more difficult than it needs to be.
-
Column labels are in one cell per column and located on the first row. Note: they don’t have to be on the first row, but they need to be in one row only. i.e. not split over multiple rows.
-
There are no subtotals interspersed in the data.
Classification of Data v/s Tabulation/Tabular Presentation of Data :
Generally, the classification of data and tabular presentation of data are misunderstood as the same, i.e., a device to present and summarize data. However, in technical terms, both concepts are different from each other. The difference between the classification of data and the tabular presentation of data is as follows:
- Tabulation succeeds classification of data. It means that tabular presentation of data can be done only when it is classified into different classes.
- Classification of data includes classifying the given set of data into different classes according to their similarities and differences. However, tabular presentation of data includes arranging the classified data into rows and columns with suitable heads and subheads.
- Classification is a method of statistical analysis. However, tabular presentation of data is a method of presenting data.
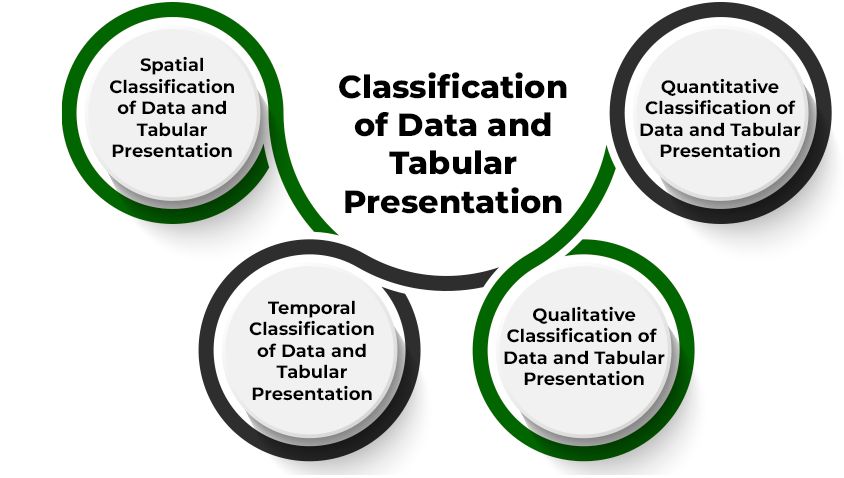
Classification of Data and Tabular Presentation :
-
1. Spatial Classification of Data and Tabular Presentation
2. Temporal Classification of Data and Tabular Presentation
3. Qualitative Classification of Data and Tabular Presentation
4. Quantitative Classification of Data and Tabular Presentation
Classification of data is also used in tabular presentation and is of four types; viz., Geographical or Spatial Classification, Chronological or Temporal Classification, Qualitative Classification, and Quantitative Classification.
1. Spatial Classification of Data and Tabular Presentation
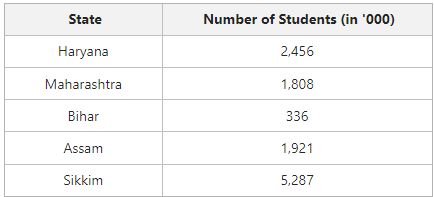
Spatial Classification of data means to classify data based on the geographical location, place, or region such as state, district, town, city, country, etc. For example, a number of students from different states at Delhi University. The Tabular presentation of the same can be shown as follows:
2. Temporal Classification of Data and Tabular Presentation
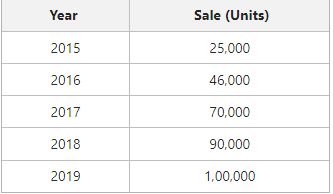
Temporal Classification of data means to classify data based on the time period. It means that time becomes the classifying variable in the case of temporal classification. For example, the sale of Laptops by a manufacturer in different years. The tabular presentation of the same can be shown as follows:
3. Qualitative Classification of Data and Tabular Presentation
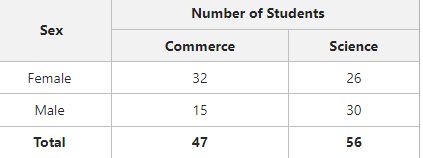
Qualitative Classification of data means to classify data based on qualitative characteristics or attributes. For example, data of the students of Class XI can be classified on qualitative attributes like male or female, and Commerce or Science. The tabular presentation of the same can be shown as follows:
4. Quantitative Classification of Data and Tabular Presentation
Quantitative Classification of data means to classify data based on the quantitative characteristics. For example, data on the number of players playing different sports in a school. The tabular presentation of the same can be shown as follows:
Conclusion: The aim and objectives of a tabular representation of data are that they represent the complex set of data in a simplified data form. Tabular representation of data brings out the essential features of data and facilitates statistics. Using the tabular representation of data also saves space.
