Advanced Excel Skills
Advanced Excel Skills
Introduction :
Excel is an important, in-demand skill in countless industries. Advanced Excel skills include the ability to produce graphs and tables, use spreadsheets efficiently, and perform calculations and automation to process large volumes of data. With the rise of big data and data analytics, advanced Excel skills are a real asset both during the job hunt and everyday work tasks.
Whether you are considering a career in data analytics or looking to enhance your skills on the job, Excel training can be valuable in preparing you for a variety of promising roles.

How can I improve my advanced Excel skills?
There are many sources available to help you gain a more in-depth understanding of complex Excel features. Here are a few steps you can take to improve your Excel skills:
- Use free online resources and video tutorials for skills that do not require complex formulae.
- Sign up for an online course or workshop to learn at your pace.
- Take an in-person course to get real-time instructions and feedback.
- Hire a tutor who can work around your schedule.
- Practice Excel skills outside the workplace.
Advanced Excel Topics
Below, we will address some of the Excel skills needed to break into the data analytics industry — as well as effective ways to learn these skills. The Columbia Engineering Data Analytics Boot Camp curriculum, for instance, can be a great way to hone your Excel skills; the data analytics boot camp covers intermediate Excel topics, which form the foundation for the following advanced Excel skills.
Statistical Modeling
Statistical modeling is a process of applying statistical models and assumptions to generate sample data and make real-world predictions. It helps data scientists visualize the relationships between random variables and strategically interpret datasets.
Excel’s statistical modeling functions include tools to create histograms, generate random numbers, find correlations between data sets, measure for rank and percentile, perform regression, and assess sampling. Using Excel to perform statistical modeling can reduce human errors sometimes involved in statistical analysis.
If you have only used Excel for basic budgeting or project management, you may be unaware of the statistical tools that can power up your Excel skills. While some of the advanced Excel tools for statistical modeling are built into the program’s basic functions, others are part of the add-on package for data analysis. Through Excel’s Data tab, you can add in the Analysis ToolPak to gain access to these important functions.

Forecasting and Prediction
If you have historical and time-based data, you can use advanced Excel functions to create forecasts and predictions of future performance. You can create this data at higher and lower confidence levels for different degrees of probability — this can be important for businesses aiming to predict stock trajectories, forecast the growth of their sales efforts, or understand changes in the economy.
Excel’s Data tab has a substantial amount of advanced tools available for users, Analytics Boot Camp can help you understand and make use of these more advanced functions. For example, if you’re working with two corresponding data series, you can insert a Forecast Sheet under the Data tab to create line or column charts with the relevant forecast. You can set your own end date for the forecast and choose from a number of options to fine-tune your results, including filling in missing points and assessing for seasonality.
Pivot Tables
Pivot tables are perhaps one of the best-known and more powerful advanced Excel skills, as they can automatically give you quick summaries of the data in a massive Excel spreadsheet by grouping matching data. For example, pivot tables can quickly graph sales data by product, financial performance by investment type, or weight of various items in inventory. These tables, launched from the Tables section of the Insert tab, can be used to count, sort, total, or average data taken from one large spreadsheet.
With pivot tables, you may eliminate the need for individual formulas in producing meaningful data analysis — one of the most important Excel skills for employers because of its versatility and efficiency. After you have mastered these advanced Excel functions, you can create a pivot table in less than a minute, whether you have only a few rows of data or thousands of rows of information. You can create the specific fields to be addressed in the table, remove duplicates, count entries and provide a range of assessments of your data. Excel even includes recommended Pivot Tables keyed to the types of data presented in your spreadsheet.

VBA and Macros
Visual Basic for Applications in Office (VBA) is a powerful, simple programming language created by Microsoft to extend and automate the capabilities of Excel and other Office software. VBA can be used to automate any function that you can perform in Excel and enables you to save the resulting code as a macro to be used repeatedly, which can dramatically ramp up efficiency and output when you have repetitive tasks or need to clean data across a range of spreadsheets.
Creating and applying macros can result in cutting a task down from days to hours, allowing you and your employer to save time. VBA programming allows you to have total control over the macros you produce — not only to automate advanced Excel functions but to create unique dialog boxes and other options for your particular business case.
Model Historic Stock Trends
A forecast refers to a calculation or an estimation which uses data from previous events, combined with recent trends to come up a future event outcome. A prediction is an actual act of indicating that something will happen in the future with or without prior information.
Excel offers a stock data type created specifically to pull in present and historical stock performance data. By modeling variations of a stock and the instruments based on it, like derivatives, you can receive a representation of the stock’s valuation at present and over time. By using the stock data type, you can bring in existing prices as well as the company name, number of employees, and other key data that can be used to perform stock modeling.
The advanced Excel function STOCK HISTORY provides access to historical data that can be formatted dynamically. By using the stocks data type and pulling in the start and end date (as well as specified properties), Excel users can pull in data over time on a specific exchange, in a certain currency, and with other specifications. This information may produce graphical representations of a particular stock’s history — as well as forecasting and prediction models to assess potential future outcomes.
Advanced Excel Formulas

Sum If
The SUMIF formula is used to add cells together when they share certain properties. For example, SUMIF can be used when those data cells have a certain number or word attached to them, indicating, for instance, a certain class or type of product. It can also be used to add information that is above or below a certain value — or that equates to a particular amount — highlighting outliers or grouping together certain kinds of information.
SUMIF is a useful formula to gather summary information about sales, enrollment, or other total figures for large data sets that encompass different types of information. The SUMIF formula takes in data including the range of cells to examine, the criteria to determine which cells should be added together, and the sum range to add together.
Conditional Formatting
In many industries, formatted Excel tables and spreadsheets are important to provide a visual representation of your data. After you’ve crunched the numbers, you need to present your information to others at your employer. In many cases, making the key data and takeaways stand out is critical to effective business communication and ensuring that your presentation is understood by listeners and readers.
Conditional formatting changes the color and appearance of a cell and its contents based on certain conditions about the type of information it contains. For example, in a financial or budgeting spreadsheet, you may want negative numbers to be highlighted in red. You may want to highlight any divergent information in yellow if they contain a certain word or error code.
By determining the type of information you want to highlight, Excel skills in conditional formatting can enable you to deliver your information visually as well as verbally. You can highlight top performers or areas that need improvement with just a few clicks and color changes.
If Error
Sometimes, you may encounter errors when performing advanced Excel functions. This may be for a number of reasons, including the absence of a certain type of data in particular rows, or it may indicate a problem that needs to be fixed. IFERROR is used to remove error codes and produce either a blank cell or a text you specify that indicates that the cell or area needs further review or attention.
However, Excel by default produces certain types of error codes that can stop calculations from running across a range of values while also presenting a disruptive, attention-grabbing appearance on the sheet for easy identification and correction.
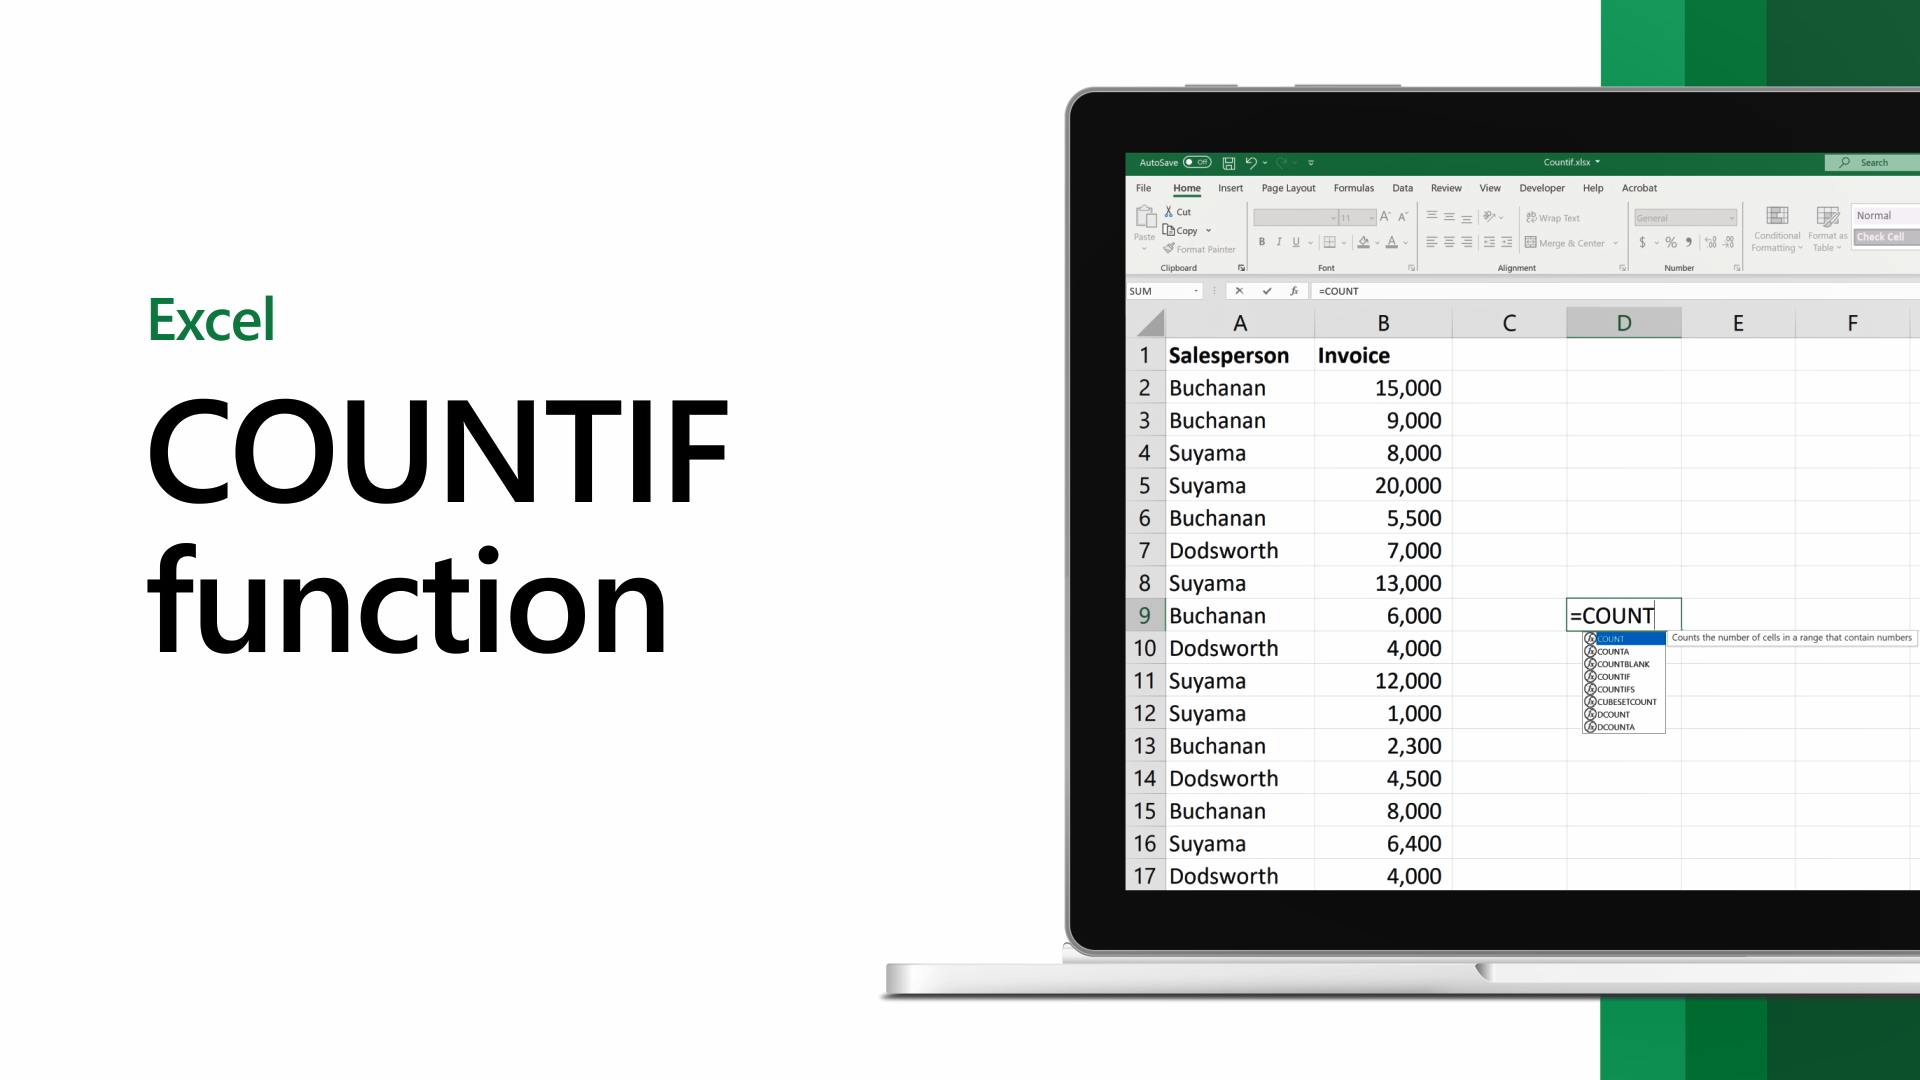
Count If
The COUNTIF function in Excel is used to count cells that have certain properties. If you want to find out how many times a certain word or entry appears in a large spreadsheet, COUNTIF examines all of your data and produces a count of the criteria that you specify. This can be very important whenever you want to know the number of things that are labeled in a particular way. Whether you want to understand the distribution of your inventory, identify where your customers are located, or determine the number of employees in a particular department, COUNTIF enables you to get this information quickly by taking in the range of cells you wish to examine as well as the criteria you are using to search.
Index Match
The combination of the INDEX and MATCH functions in Excel provides a more advanced way to look up and assess information inside an Excel sheet or workbook. While functions like VLOOKUP and HLOOKUP allow you to search for information, they have limitations on where and how they search that can prevent you from easily obtaining the information you need. The MATCH function is nested inside the INDEX function and can be used to find a certain type of data, while INDEX is used to connect that information to the other data available in its row.
In other words, MATCH allows you to find the position of a value in a range, and then INDEX is used to return a specific value in relation to the original value. It is important for two-way lookups and case-sensitive lookups, and you can even use it to find the closest match from the data you have.
Conclusion
In conclusion, advanced Excel skills are becoming increasingly vital in today's data-driven world. From data analytics to financial modeling, Excel proficiency opens doors to promising career opportunities and enhances everyday work efficiency. By mastering statistical modeling, forecasting, pivot tables, VBA, and macros, professionals can streamline data analysis and automate repetitive tasks. Additionally, the ability to model historic stock trends and utilize advanced Excel formulas like SUMIF, conditional formatting, IFERROR, COUNTIF, and Index Match further empowers users to extract valuable insights and present data visually.
